
|
阅读:3620回复:0
使用Leaflet创建地图拓扑图之前我们采用过 Openlayers+Qunee的方案,实现地图拓扑图,鉴于Openlayers是一种古老项目,略显臃肿,面向更新的前端地图方案,在客户的介绍下,我们找到了leaflet - 基于HTML5的轻量地图客户端方案,结合Qunee使用,以及第三方插件,实现更加轻快的地图拓扑图应用 Leaflet介绍 leaflet是一个开源软件,作者在乌克兰,在移动设备上的有良好的体验,比较新和现代的地图客户端,类库压缩后只有33k,非常小巧,这一点让qunee都相形见绌,先看一个leaflet的入门示例 官方示例 // create a map in the"map"div, set the view to a given place and zoom var map = L.map('map').setView([51.505, -0.09], 13); // add an OpenStreetMap tile layer L.tileLayer('http://{s}.tile.osm.org/{z}/{x}/{y}.png').addTo(map); // add a marker in the given location, attach some popup content to it and open the popup L.marker([51.5, -0.09]).addTo(map) .bindPopup('A pretty CSS3 popup. Easily customizable.') .openPopup(); 运行效果如下: 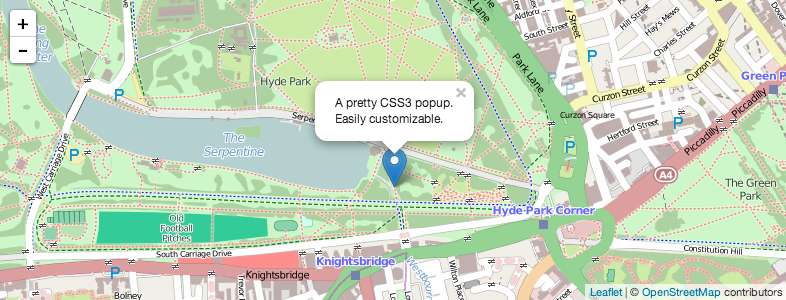 结合Qunee拓扑图 Leaflet地图上可以添加点线面基本图形,如果需要展示更复杂的图形或者链接关系,显得力不足,可以结合Qunee组件使用,下面我们让地图和拓扑图叠加起来,在地图上显示拓扑元素,并整合两者的交互 图层叠加 在地图的DIV容器中添加一个孩子div,作为拓扑图的画布,并设置相应的css,然后调用超类的构造函数,取消默认的双击和滚轮操作,已被后面地图与拓扑图的交互同步 var MapGraph = function (map) { var container = map._container; var canvas = document.createElement("div"); canvas.style.width ="100%"; canvas.style.height ="100%"; container.appendChild(canvas); Q.doSuperConstructor(this, MapGraph, [canvas]); this.enableWheelZoom = false; this.enableDoubleClickToOverview = false; this.originAtCenter = false; this.setMap(map); ... } 关联地图 下面实现拓扑图与地图的绑定,在#setMap(map)函数中,监听了地图的zoomstart和zoomend事件,根据经纬度动态的调整图元的屏幕位置,同样在节点被拖动后,也需要设置新的经纬度 MapGraph.prototype = { map: null, mapShowing: true, enableInertia: false, createNodeByLonLat: function (name, lon, lat) { var l = this.toLonLat(lon, lat); var p = this.getPixelFromLonLat(l); var node = graph.createNode(name, p.x, p.y); node.lonLat = l; return node; }, toLonLat: function (lon, lat) { return new L.latLng(lat, lon); }, getPixelFromLonLat: function (lonLat) { return this.map.latLngToContainerPoint(lonLat, this.map._zoom); }, getLonLatFromPixel: function (x, y) { return this.map.containerPointToLatLng([x, y]); }, setMap: function (map) { this.map = map; this.map.on("zoomstart", this.hideGraph, this); this.map.on("zoomend", this.updateNodes, this); this.html.ondblclick = createEventFunction(this, function (evt) { if (this.getElementByMouseEvent(evt)) { Q.stopEvent(evt); } }); this.interactionDispatcher.addListener(function (evt) { if (evt.kind == Q.InteractionEvent.ELEMENT_MOVE_END) { var datas = evt.datas; Q.forEach(datas, function (data) { var pixel = this.toCanvas(data.location.x, data.location.y); data.lonLat = this.getLonLatFromPixel(pixel.x, pixel.y); }, this); } }, this) }, hideGraph: function(){ this.html.style.visibility ="hidden"; }, showGraph: function(){ this.html.style.visibility =""; }, translate: function (tx, ty) { Q.doSuper(this, MapGraph,"translate", arguments); this.map.panBy([-tx, -ty], {animate: false}); }, resetVisibility: function () { this.forEach(function (e) { if (e.invalidateVisibility) { e.invalidateVisibility(true); } }); }, updateNodes: function () { this.translateTo(0, 0, 1, true); this.resetVisibility(); this.forEach(function (d) { if (d instanceof Q.Node) { var l = d.lonLat; var p = this.getPixelFromLonLat(l); d.location = p; } }, this); this.showGraph(); } } Q.extend(MapGraph, Q.Graph); 此外还可以通过可见过滤器实现,不同比例尺显示不同的节点 运行效果 在线示例: http://demo.qunee.com/map/mapByLeafLet.html 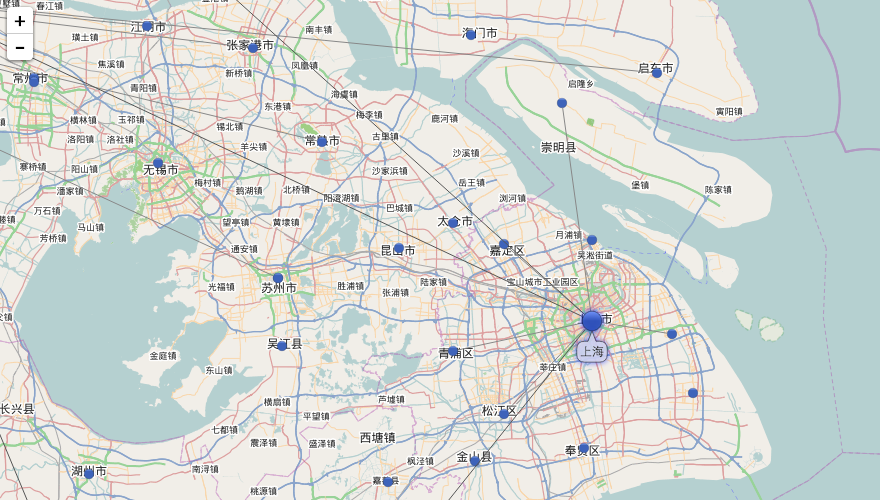 |
|
|