管理员

- 注册日期2003-07-16
- 发帖数15951
- QQ
- 铜币25345枚
- 威望15368点
- 贡献值0点
- 银元0个
|
阅读:2727回复:0
HT for Web整合OpenLayers实现GIS地图应用
楼主#
更多
发布于:2015-05-20 19:27
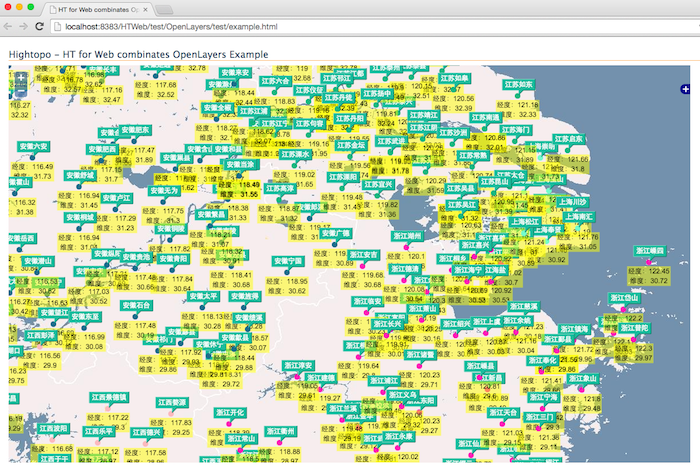
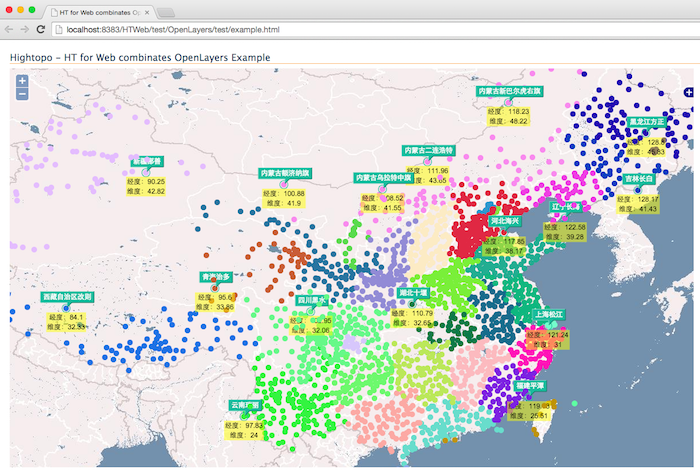
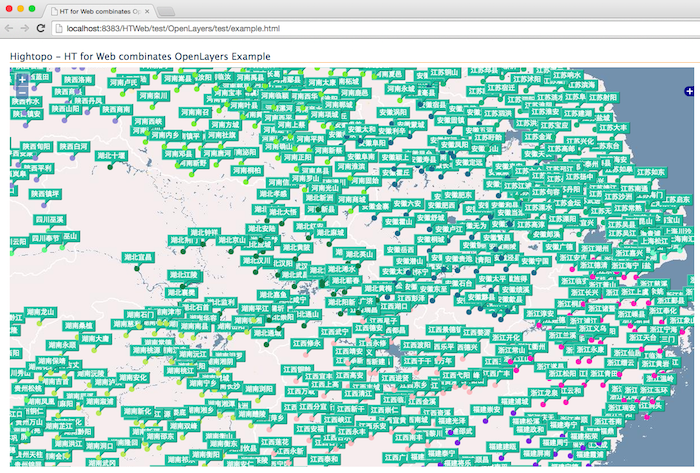
HT for Web作为逻辑拓扑图形组件自身没有GIS功能,但可以与各种GIS引擎即其客户端组件进行融合,各取所长实现逻辑拓扑和物理拓扑的无缝融合,本章将具体介绍HT
for Web与开发免费的OpenLayers地图结合应用的关键技术点,该文介绍的结合的原理,其实还可推广到与ArcGIS、百度地图以及GoogleMap等众多GIS地图引擎融合的解决方案。
- function init(){
- graphView = new ht.graph.GraphView();
- var view = graphView.getView();
-
- map = new OpenLayers.Map("map");
- var ol_wms = new OpenLayers.Layer.WMS(
- "OpenLayers WMS",
- "http://vmap0.tiles.osgeo.org/wms/vmap0",
- {layers: "basic"}
- );
- map.addLayers([ol_wms]);
- map.addControl(new OpenLayers.Control.LayerSwitcher());
- map.zoomToMaxExtent();
- map.events.fallThrough = true;
-
- map.zoomToProxy = map.zoomTo;
- map.zoomTo = function (zoom,xy){
- view.style.opacity = 0;
- map.zoomToProxy(zoom, xy);
- console.log(zoom);
- };
-
- map.events.register("movestart", this, function() {
- });
- map.events.register("move", this, function() {
- });
- map.events.register("moveend", this, function() {
- view.style.opacity = 1;
- reset();
- });
-
- graphView.getView().className = 'olScrollable';
- graphView.setScrollBarVisible(false);
- graphView.setAutoScrollZone(-1);
- graphView.handleScroll = function(){};
- graphView.handlePinch = function(){};
- graphView.mi(function(e){
- if(e.kind === 'endMove'){
- graphView.sm().each(function(data){
- if(data instanceof ht.Node){
- var position = data.getPosition(),
- x = position.x + graphView.tx(),
- y = position.y + graphView.ty();
-
- data.lonLat = map.getLonLatFromPixel(new OpenLayers.Pixel(x, y));
- }
- });
- }
- });
- graphView.enableToolTip();
- graphView.getToolTip = function(event){
- var data = this.getDataAt(event);
- if(data){
- return '城市:' + data.s('note') + '
- 经度:' + data.lonLat.lon + '
- 维度:' + data.lonLat.lat;
- }
- return null;
- };
- graphView.isVisible = function(data){
- return map.zoom > 1 || this.isSelected(data);
- };
- graphView.isNoteVisible = function(data){
- return map.zoom > 6 || this.isSelected(data);
- };
- graphView.getLabel = function(data){
- return '经度:' + data.lonLat.lon + '\n维度:' + data.lonLat.lat;
- };
- graphView.isLabelVisible = function(data){
- return map.zoom > 7 || this.isSelected(data);
- };
-
- view.addEventListener("ontouchend" in document ? 'touchstart' : 'mousedown', function(e){
- var data = graphView.getDataAt(e);
- if(data || e.metaKey || e.ctrlKey){
- e.stopPropagation();
- }
- }, false);
- view.style.position = 'absolute';
- view.style.top = '0';
- view.style.left = '0';
- view.style.right = '0';
- view.style.bottom = '0';
- view.style.zIndex = 999;
- map.viewPortDiv.appendChild(view);
-
- var color = randomColor();
- lines = china.split('\n');
- for(var i=0; i<lines.length; i++) {
- line = lines.trim();
- if(line.indexOf('【') === 0){
- //province = line.substring(1, line.length-1);
- color = randomColor();
- }else{
- var ss = line.split(' ');
- if(ss.length === 3){
- createNode(parseFloat(ss[1].substr(3)), parseFloat(ss[2].substr(3)), ss[0].substr(3), color);
- }
- }
- }
- }
-
- function reset(){
- graphView.tx(0);
- graphView.ty(0);
- graphView.dm().each(function(data){
- if(data.lonLat){
- data.setPosition(map.getPixelFromLonLat(data.lonLat));
- }
- });
- graphView.validate();
- }
-
- function createNode(lon, lat, name, color){
- var node = new ht.Node();
- node.s({
- 'shape': 'circle',
- 'shape.background': color,
- 'note': name,
- 'label.background': 'rgba(255, 255, 0, 0.5)',
- 'select.type': 'circle'
- });
- node.setSize(10, 10);
- var lonLat = new OpenLayers.LonLat(lon, lat);
- lonLat.transform('EPSG:4326', map.getProjectionObject());
- node.setPosition(map.getPixelFromLonLat(lonLat));
- node.lonLat = lonLat;
- graphView.dm().add(node);
- return node;
- }
|